Golf Related Supplies

Golf Retail Impact
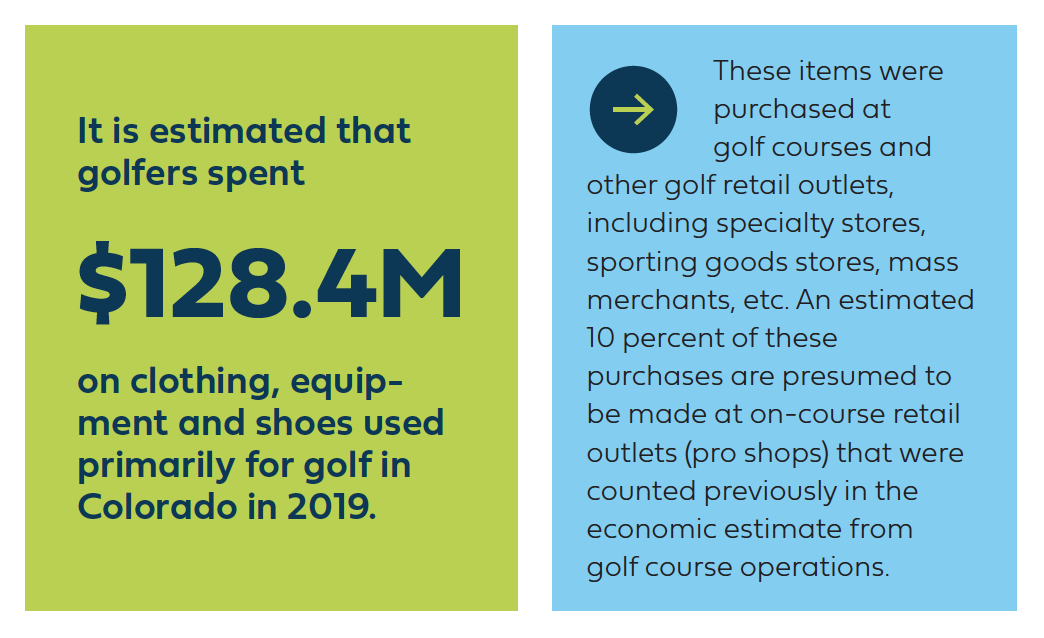
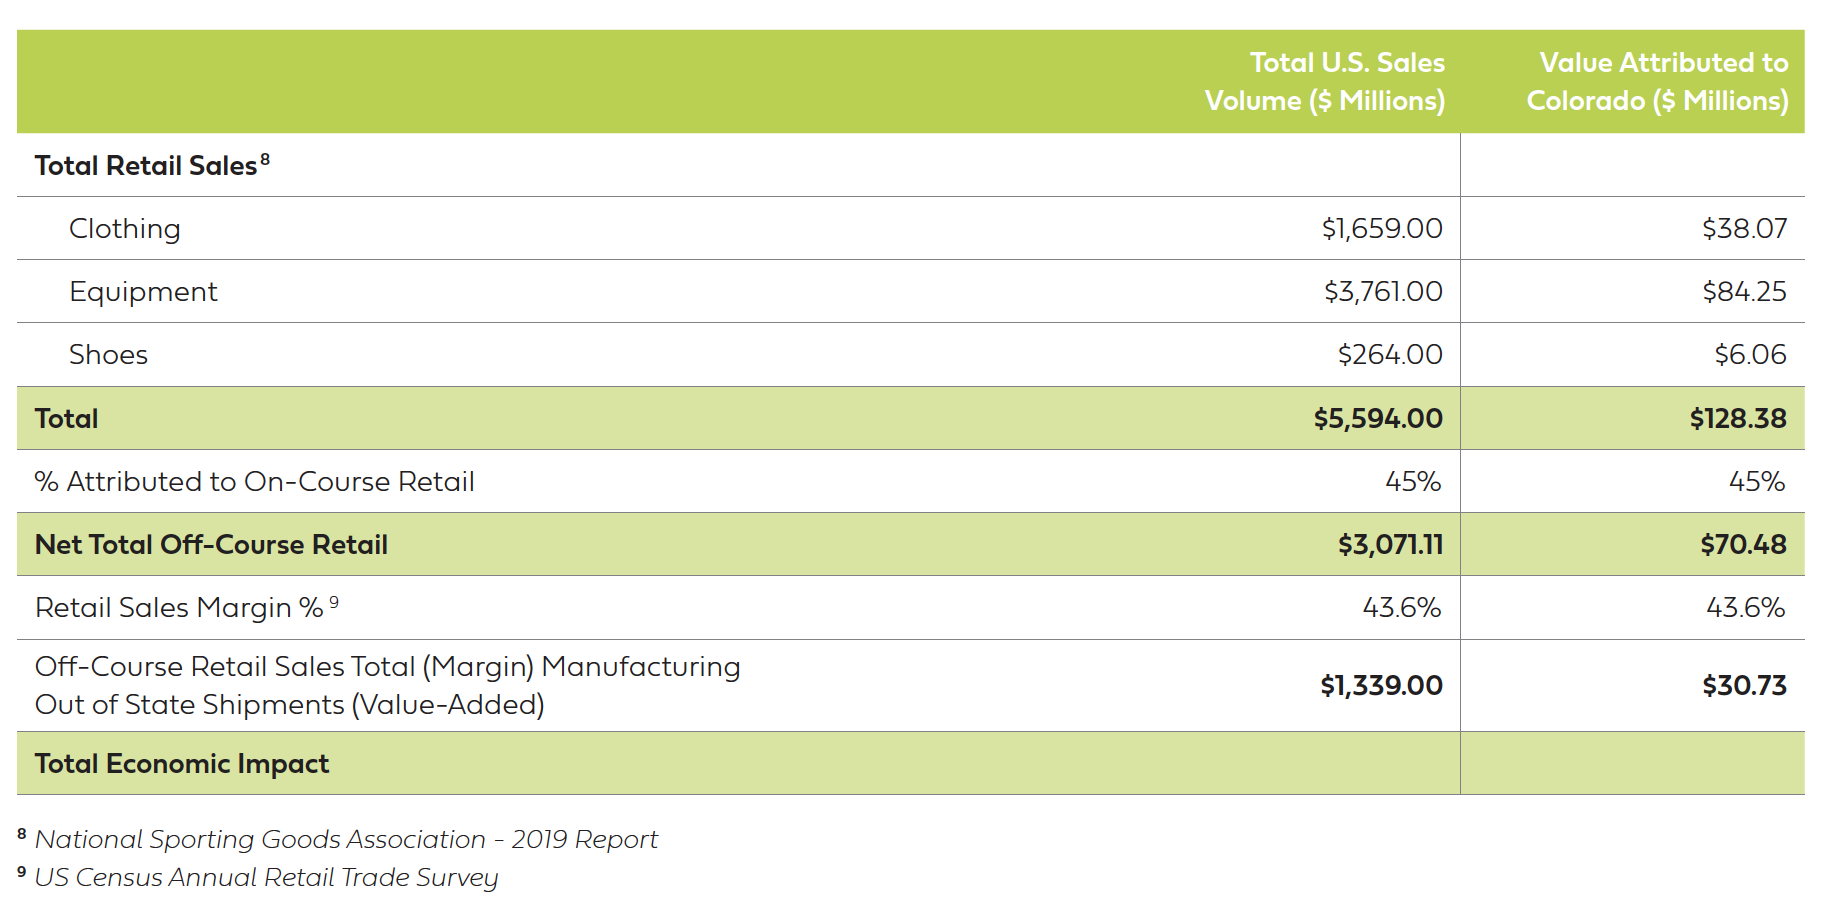
The economic value created by golfer supplies consists of three components: (1) manufacturing cost of materials; (2) manufacturing value added; and (3) retailer’s net revenue from sales. Since there are no significant manufacturers of golf-related supplies in the state of Colorado, the bulk of the impact is derived from retail margins. Consumer purchases of golf apparel, equipment, and shoes drive significant economic activity. Colorado off-course retailers earned a $30.73 million margin on $70.48 million of golf clothing off-course gross retail sales, equipment and shoes in 2019 (NGF previously estimated $58.0 million in on-course retail).
Golf Related Supplies Revenue – State of Colorado 2019
Approach
What is measured
This segment captures both: (1) the net revenue (known as retail margin) that accrues to Colorado retailers from spending by golfers on golf equipment, golf shoes, and golf apparel; and (2) the manufacture of these goods by Colorado companies. In addition to the manufacture of golf-related consumer goods, this segment captures the manufacture of golf carts, golf course accessories, and turf maintenance equipment. Like golfers, golf facilities also make purchases of goods to facilitate the game and facility operations.
How it’s measured
Data to calculate on-course and off-course retail spending on golf equipment, golf shoes, and golf apparel comes from the National Sporting Goods Association (NGSA). The NSGA conducts an annual survey of 100,000 households. NSGA has collected this data since 2002. Sales for different categories of purchases are broken down by geographic region, and state-level sales are estimated to be 2.3 percent of the national total, based on Colorado’s share of 18-hole equivalent facilities for the Rocky Mountain Region (Rocky Mountain Region = 8.5 percent of U.S. / Colorado percent of region courses in Colorado = 27 percent).
The estimation of economic impact is based upon the retail margin that accrues to Colorado companies that sell golf equipment and apparel. The U.S. Census Bureau’s Annual Retail Trade Survey reports the retail margin for different industry sectors. The most recent retail margin available for sporting goods stores (43.6 percent in 2019) was used to estimate the retail margin accruing to Colorado companies. The retail margin is the net revenue accruing to the business after paying for the cost of goods from the wholesaler or manufacturer.
Services and Manufacturing Impact


The second type of activity captured is golf-related service manufacturing activity—companies that produce golf equipment, apparel, golf carts, turf maintenance equipment, and golf course accessories, as well as those companies that provide direct golf-related services like golf architecture, construction and/or other related consulting services.
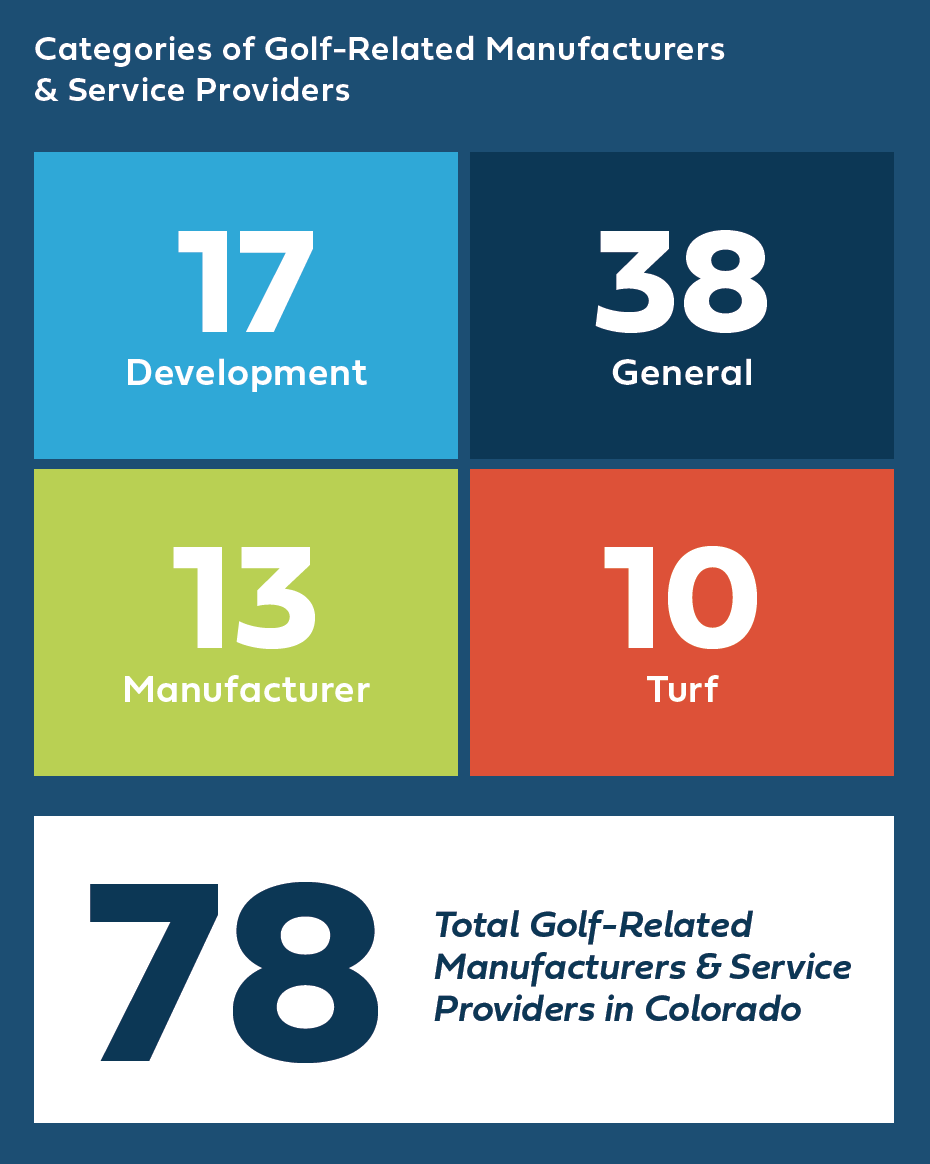
To identify golf-related manufacturers and service providers, a proprietary NGF database of golf businesses in Colorado was used along with input from the Colorado Golf Coalition. There were 78 companies that identified themselves as being providers of golf products and services, including several major golf architects, consultants and turf companies. GOLFTEC, a national swing mechanics and golf equipment retailer has its headquarters in Englewood. These companies are divided by category as noted below:
Annual revenue and employment numbers for these companies come from Reference USA[10] information and data provided to local public libraries. The share of sales going to in-state customers (estimated at 75 percent - Source: NGF) was subtracted from total sales to avoid double-counting with golf facility operations and retail consumer golf sales segments. The IMPLAN data and modeling software calculates economic impact based on the value added for manufacturing, i.e., the company’s wholesale revenue minus the cost of production inputs.
In total, these golf-related companies generated the following revenue:
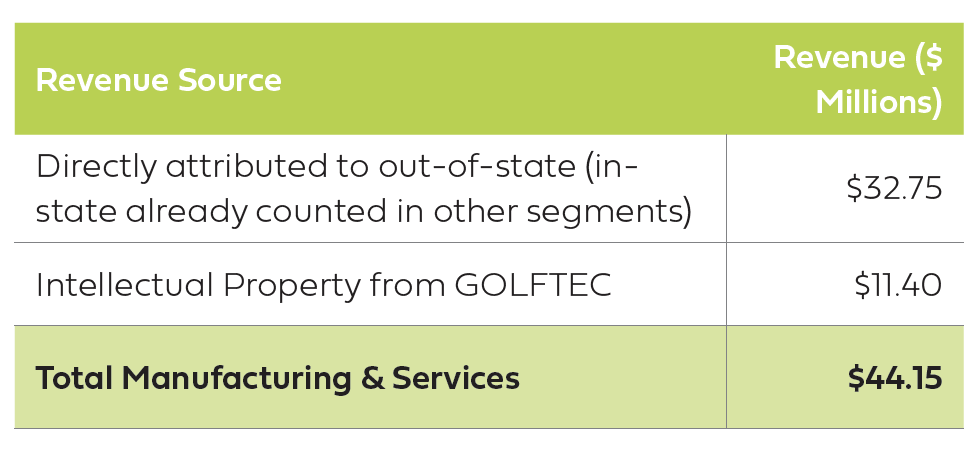
This figure represents the total revenue derived from golf products and services to customers in Colorado.

[8] Irwin Broh Research. The Sporting Goods Market: 2019 Edition. NSA – National Sporting Association. 2019
[9]https://www.census.gov/programs-surveys/arts.html
[10] Reference USA. “ReferenceUSA U.S. Business Database/ Quick Search”. Jan 2020. (2019 Data) <http://resource.referenceusa.com/>